
Zabbix Architecture: A Deep Dive into Monitoring Server
Zabbix Architecture: A Deep Dive into Monitoring Server
Zabbix Architecture Guide for Advanced Infrastructure Monitoring
Table of Contents
- Introduction
- Data Collection
- Data Sources
- Zabbix Server
- Web Interface
- Processing & Analysis
- Notifications & Actions
- Zabbix Server Architecture Diagram
- Conclusion
Introduction of Zabbix
Zabbix is a powerful monitoring solution designed to track the health and performance of IT infrastructure. Whether you’re monitoring servers, network devices, virtual machines, or applications, Zabbix offers a scalable and flexible architecture that supports real-time data collection, analysis, and automated response. Let’s discuss the architecture to understand how it all fits together.
Data Collection: The Frontline of Monitoring
On the periphery of the Zabbix infrastructure is the data collection level. This is where Zabbix interacts with other systems to collect data and status information that supports a variety of protocols and techniques:
- Zabbix Agents: Lightweight daemons that are installed on the target systems for collecting data.
- SNMP: Best suited for network devices such as routers and switches.
- JMX (Java Management Extensions): Used for Java application monitoring.
- IPMI (Intelligent Platform Management Interface): Allows hardware-level monitoring.
- HTTP Checks: Used for web service availability and response checks.
- Scripts: Custom scripts enable customized data collection for specific scenarios.
These methods ensure Zabbix can monitor any component in your infrastructure.
Data Sources: What We Monitor
Zabbix collects data from a wide range of sources:
- Network Devices: Switches, routers, firewalls, and more.
- Virtual Machines: Servers, hypervisors and guest systems across platforms.
This flexibility makes Zabbix suitable for hybrid environments, from on-premises setups to cloud deployments.
Zabbix Server: The Core Engine
The heart of the architecture, zabbix server is central component orchestrates all monitoring activities:
- Receives data from agents and other sources.
- Stores data in a backend database (MySQL, PostgreSQL, etc).
- Processes triggers to detect anomalies or threshold breaches.
- Coordinates actions like notifications and auto-remediation.
The core engine is the brain of the operation, ensuring that data flows smoothly and insights are generated promptly.
Web Interface: Visualizing the Metrics
Zabbix has a robust Web Interface that provides:
- Dashboards: Customizable views of key metrics.
- Graphs: Visual representation of trends and performance.
- Maps: Topological views of monitored infrastructure.
- Reports: Summarized insights for stakeholders.
Accessible via browser, this interface empowers admin and users to interact with monitoring data intuitively.
Processing & Analysis: Making Sense of Data
- Preprocessing: Cleans and transforms raw data.
- Triggers: Logical conditions that define when an alert should be raised.
- Trigger Correlation: Helps reduce noise by linking related events.
- Anomaly Detection: Uses patterns to identify unusual behavior.
This analytical engine ensures that alerts are meaningful and actionable.
Notifications & Actions: Responding in Real Time
When issues are detected, Zabbix can initiate a range of responses:
- Email and SMS Alerts: Immediate notifications to responsible teams.
- Slack Integration: Seamless collaboration and incident management.
- Script Execution: Custom remediation actions.
- Auto-remediation: Automated fixes to restore service without human intervention.
These capabilities make Zabbix not just a monitoring tool, but a proactive operations platform.
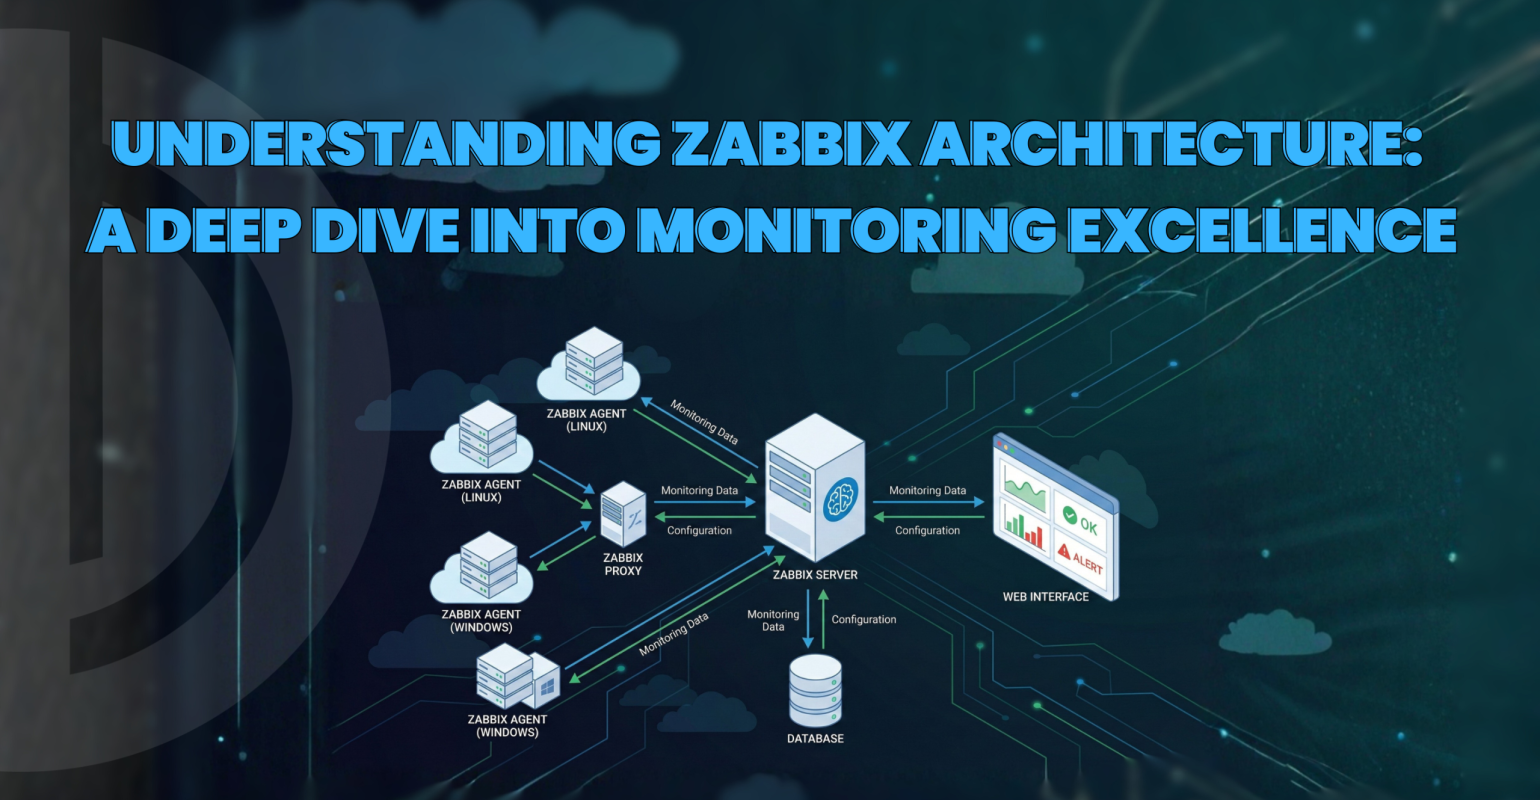
Zabbix Server Architecture Diagram

Conclusion
Zabbix’s architecture is a testament to its versatility and robustness. From data collection to intelligent alerting, every component is designed to deliver reliable, scalable, and actionable monitoring. Whether you’re managing a small network or a global infrastructure, Zabbix provides the tools to keep your systems healthy and your teams informed.
Reference links:
How to Monitor a Website on Zabbix
A Complete Comprehensive Guide to Install and Configure Zabbix 6.0 in Ubuntu 20.04/22.04 with MySQL Database on Apache Server
Written By Junaid Farooqui


